Fundamentals
Classification metrics
Confusion matrix
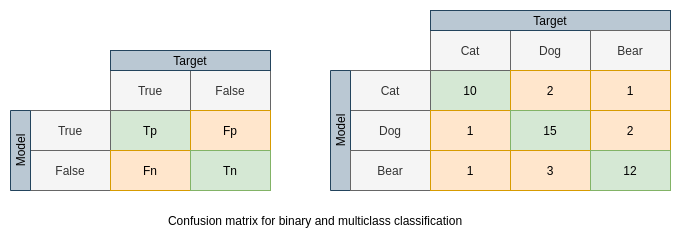
Accuracy, Recall(Sensitivity), Specificity
\begin{equation} Accuracy = \frac{Tp + Tn}{P + N} \end{equation}
\begin{equation} Precision = \frac{Tp}{Tp + Fp} \end{equation}
\begin{equation} Recall = TruePositiveRate = Sensitivity = \frac{Tp}{Tp + Fn} \end{equation}
\begin{equation} Specificity = \frac{Tn}{Tn + Fp} \end{equation}
\begin{equation} FalsePositiveRate = 1 - Specificity = \frac{Fp}{Tn + Fp} \end{equation}
F1
\begin{equation} F_1 =\frac{2}{precision^{-1} + recall^{-1}} = 2 \frac{precision \; recall}{precision + recall} \end{equation}
$F_\beta$ in case of different ratio of precision and recall
\begin{equation} F_\beta = (1 + \beta^2) \frac{precision \; recall}{\beta^2 precision + recall} \end{equation}
ROC, AUC
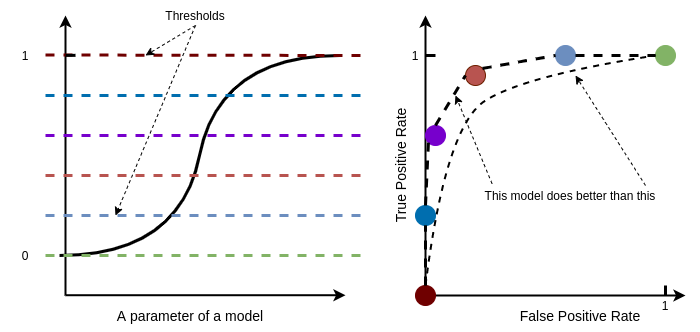
Here is an example how Logistic Regression curve. Changing the threshold leads to different Confusion Matrices and respectively to different FPR and TPR.
Mean Average Precision (mAP)
mAP is popular metric in object detection and instance segmentation problems.
Average Precision is the area under precision-recall curve. To get multiple precision-recall pairs in case of instance segmentation and object detection IoU is calculated using different thresholds. mAP is AP values averaged over different categories.
Overfitting and underfitting in terms of Empirical Risk Minimization
-
overfitting: when empirical risk is low but the true risk is too high. It can happen if the dataset is too small, if model is too powerful.
-
underfitting: when empirical risk is high and the true risk is high. This can happen if the model is too weak, or for, example if there are some problems with optimization parameters.